Gas market overview Q3 2023
Well prepared for winter ahead
- Mixed price action in Q3
- Physical supply of gas for this winter is secured
- Baltic and Finnish gas demand rises first time since the war in Ukraine
- Australian strikes highlight the global nature of LNG market
- What to expect from winter ahead
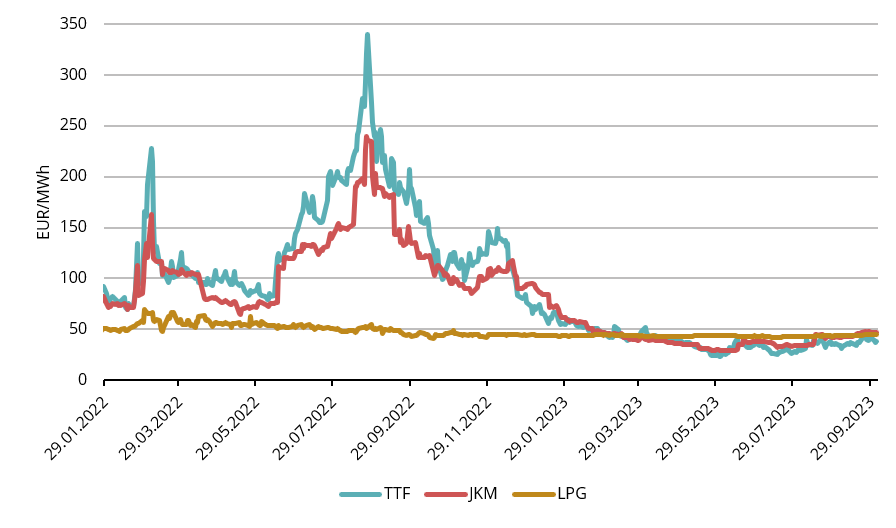
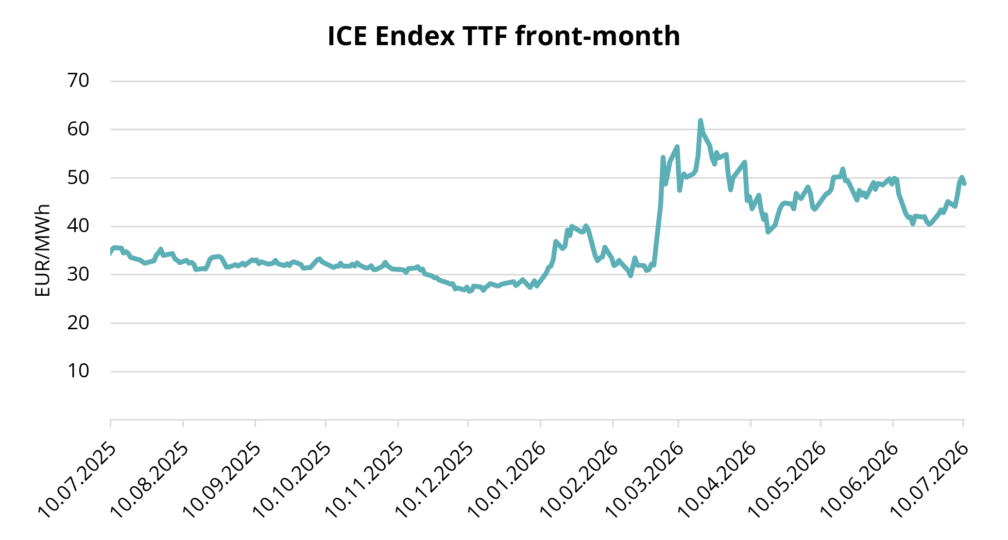
Figure 1. Gas prices, Refinitiv
Mixed price action in Q3
The average European natural gas benchmark TTF price was 32.23 EUR/MWh for Q3 2023 deliveries. In the first month of the quarter, July, prices continued the big downtrend which we have seen since the end of summer 2022. August reminded everyone again the volatile nature of the gas markets, witnessing a substantial 35% spike in prices for front-month deliveries. It was caused by the potential supply disruption in Australia (we will discuss it more in depth in fourth chapter).
The TTF forward price for the nearest full month, Nov 2023, closed at 41.859 EUR/MWh on 29th of September. Throughout Q3, the market experienced mixed price actions. Challenges on the supply side, particularly maintenances in Norwegian gas fields and potential disruptions in Australian LNG exports, were offset by a relatively stable demand scenario as storages were filled in consistent tempo, without rushing which we saw last summer.
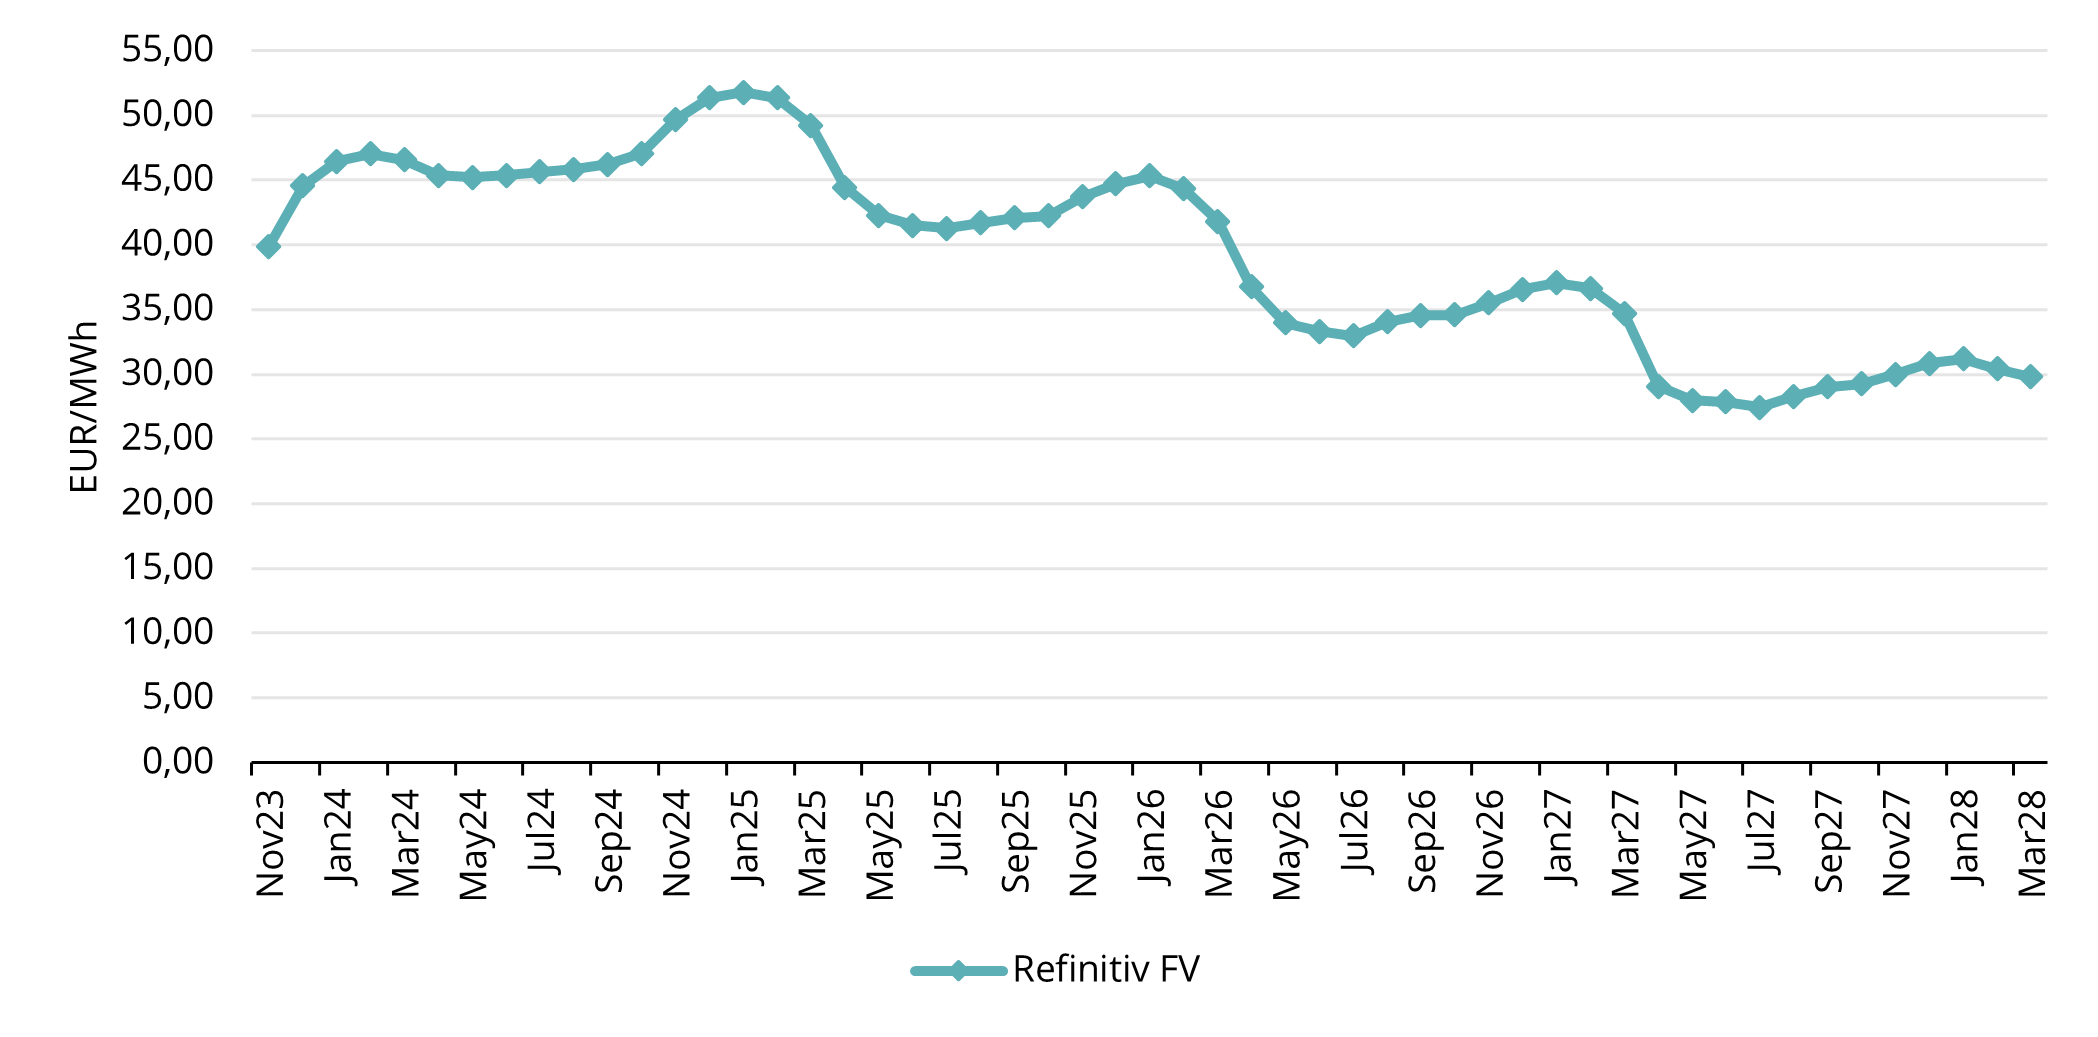
Figure 2. Natural Gas forward prices, Refinitiv
Looking at the forward curve, prices are in contango on the first part of the curve, meaning prices in winter are higher than the current spot prices. Winter months were priced between 45-47 EUR/MWh as of 29th of September (see fig. 2).
Physical supply of gas for this winter is secured
Gas storages play a critical role in ensuring supply security within Europe, especially as the demand escalates during winter due to colder weather. Relying solely on LNG cargoes would not be enough to meet the needs during this heightened demand. Hence, storages are filled during the summer, and around November, they move to withdrawal mode as additional supply is needed (see fig.3). As of the end of September, the inventory levels in Northwest Europe stand at nearly 95% capacity (Refinitiv), a notably higher figure than the historical average (see fig.4). For instance, in accordance with the European Union’s regulations, 90% storage capacity is mandated by the first of November. This means Europe has been able to achieve almost the best possible scenario and is fully prepared for the winter ahead.
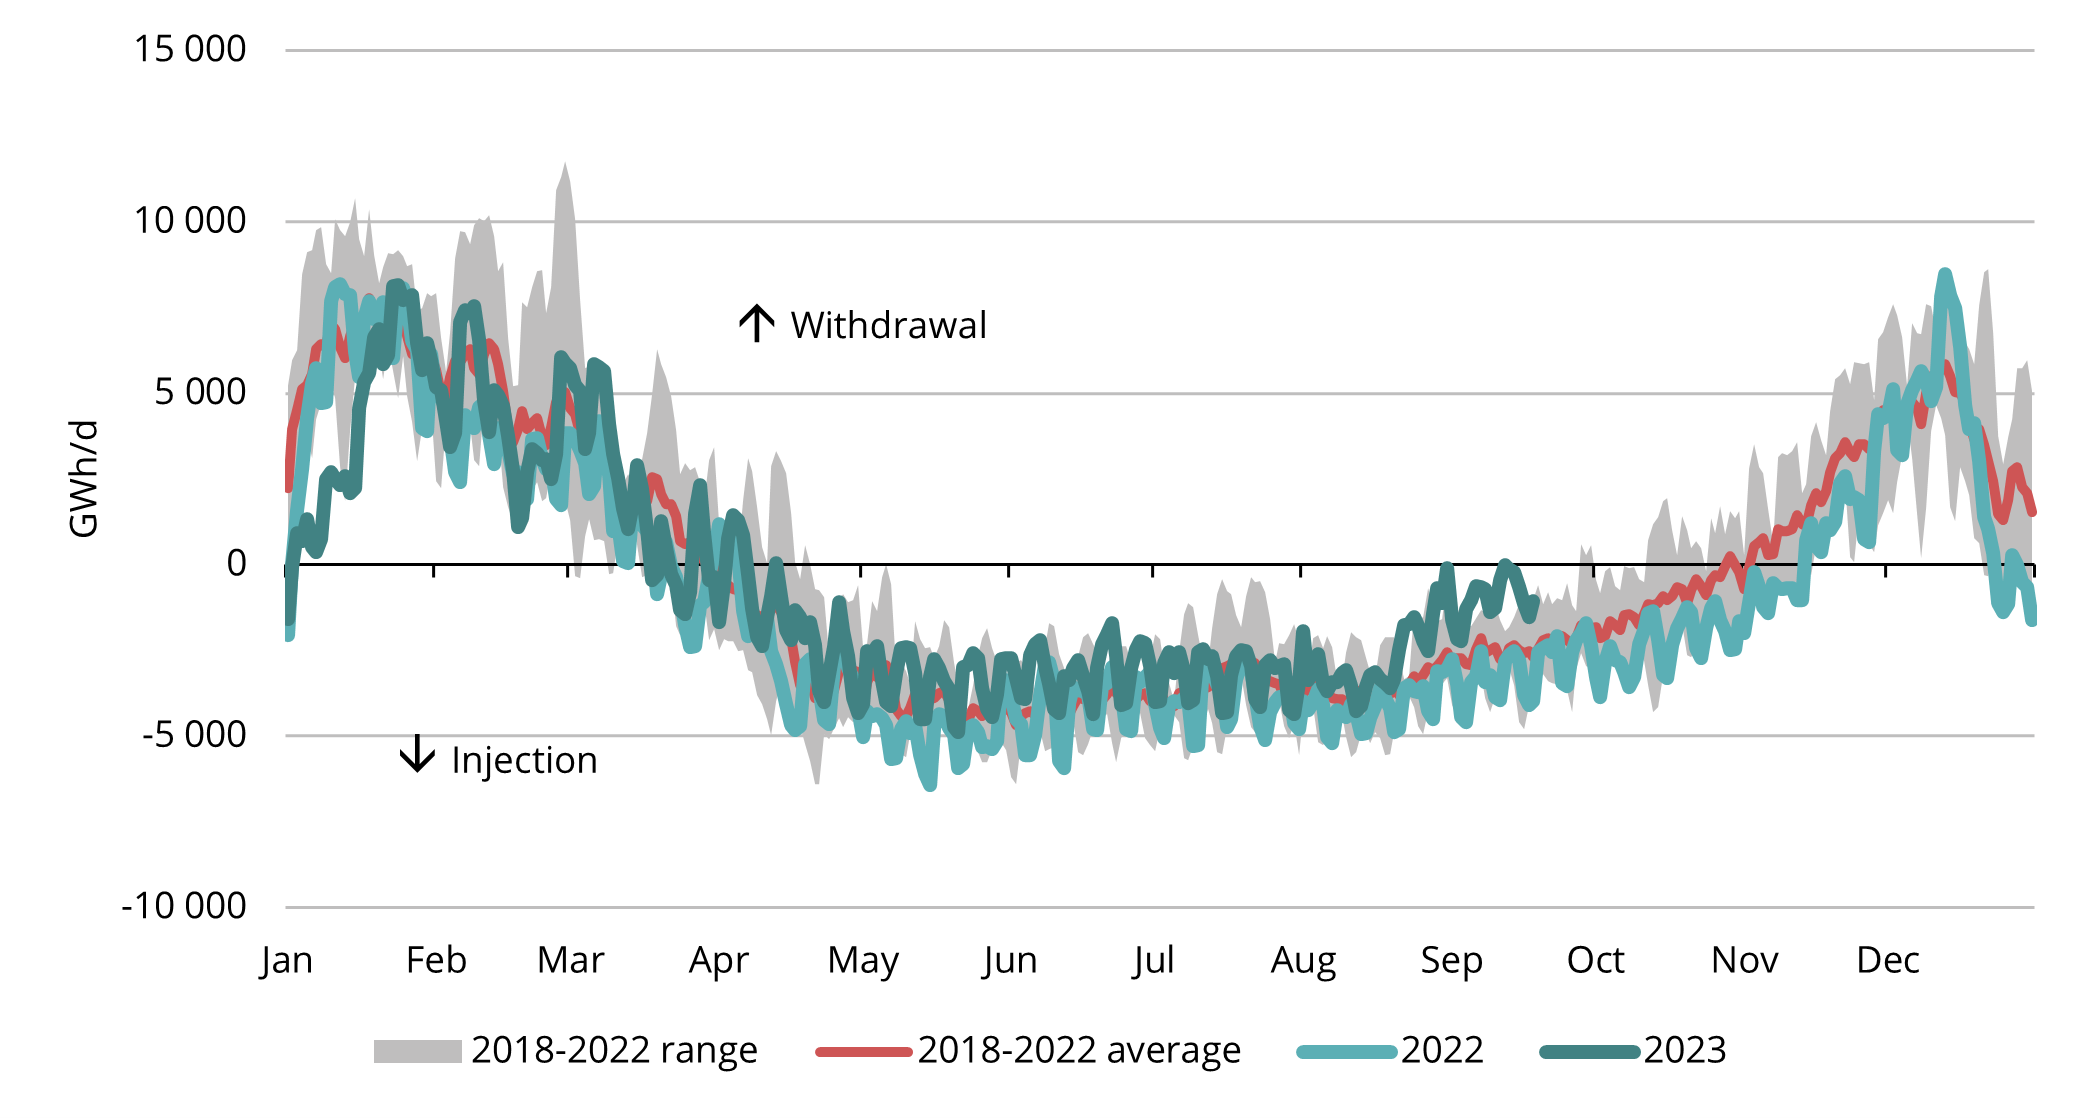
Figure 3. Seasonal injection and withdrawal at European storages, 2018-2023, AGSI+
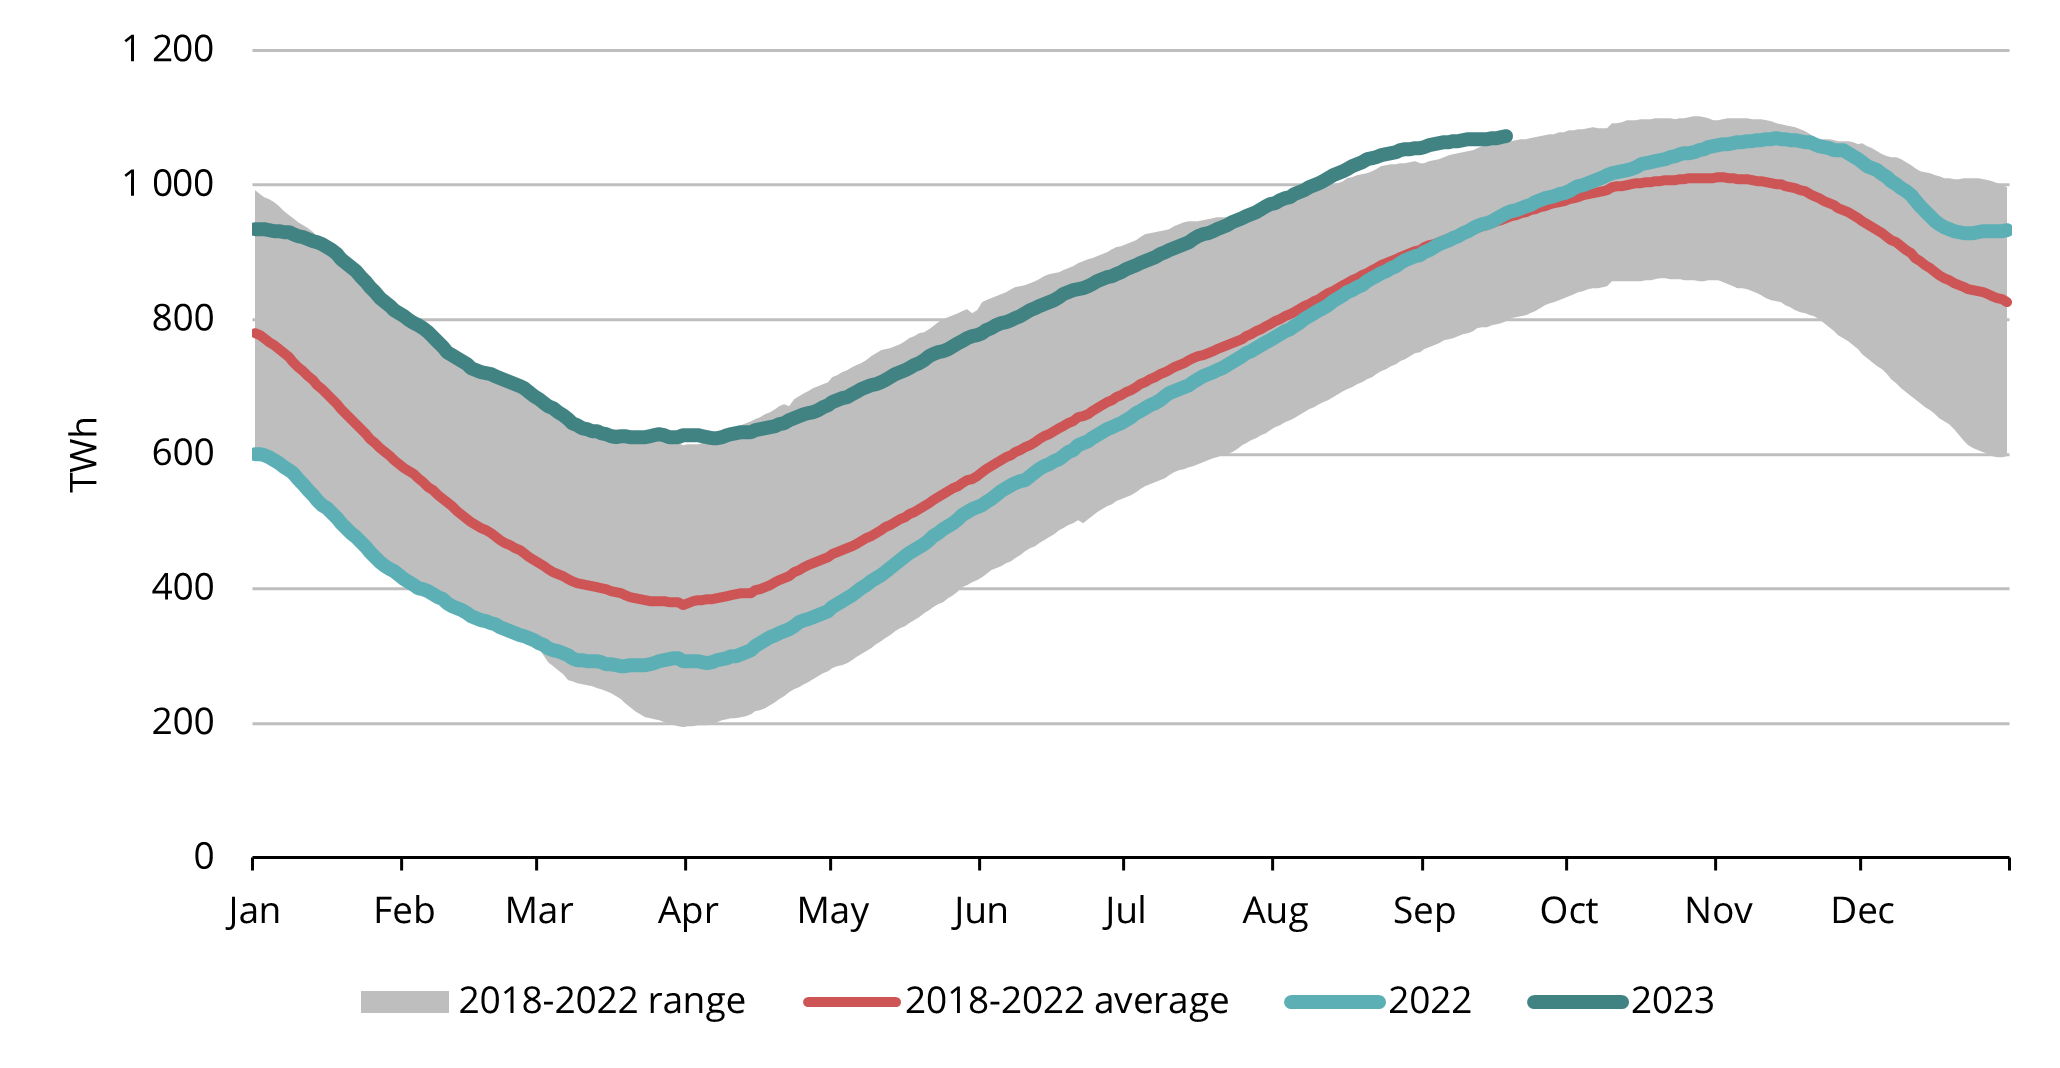
Figure 4. Gas in European storage, 2018-2023, AGSI+
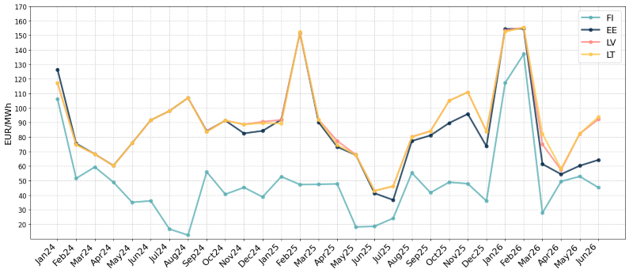
Baltic and Finnish gas demand rises first time since the war in Ukraine
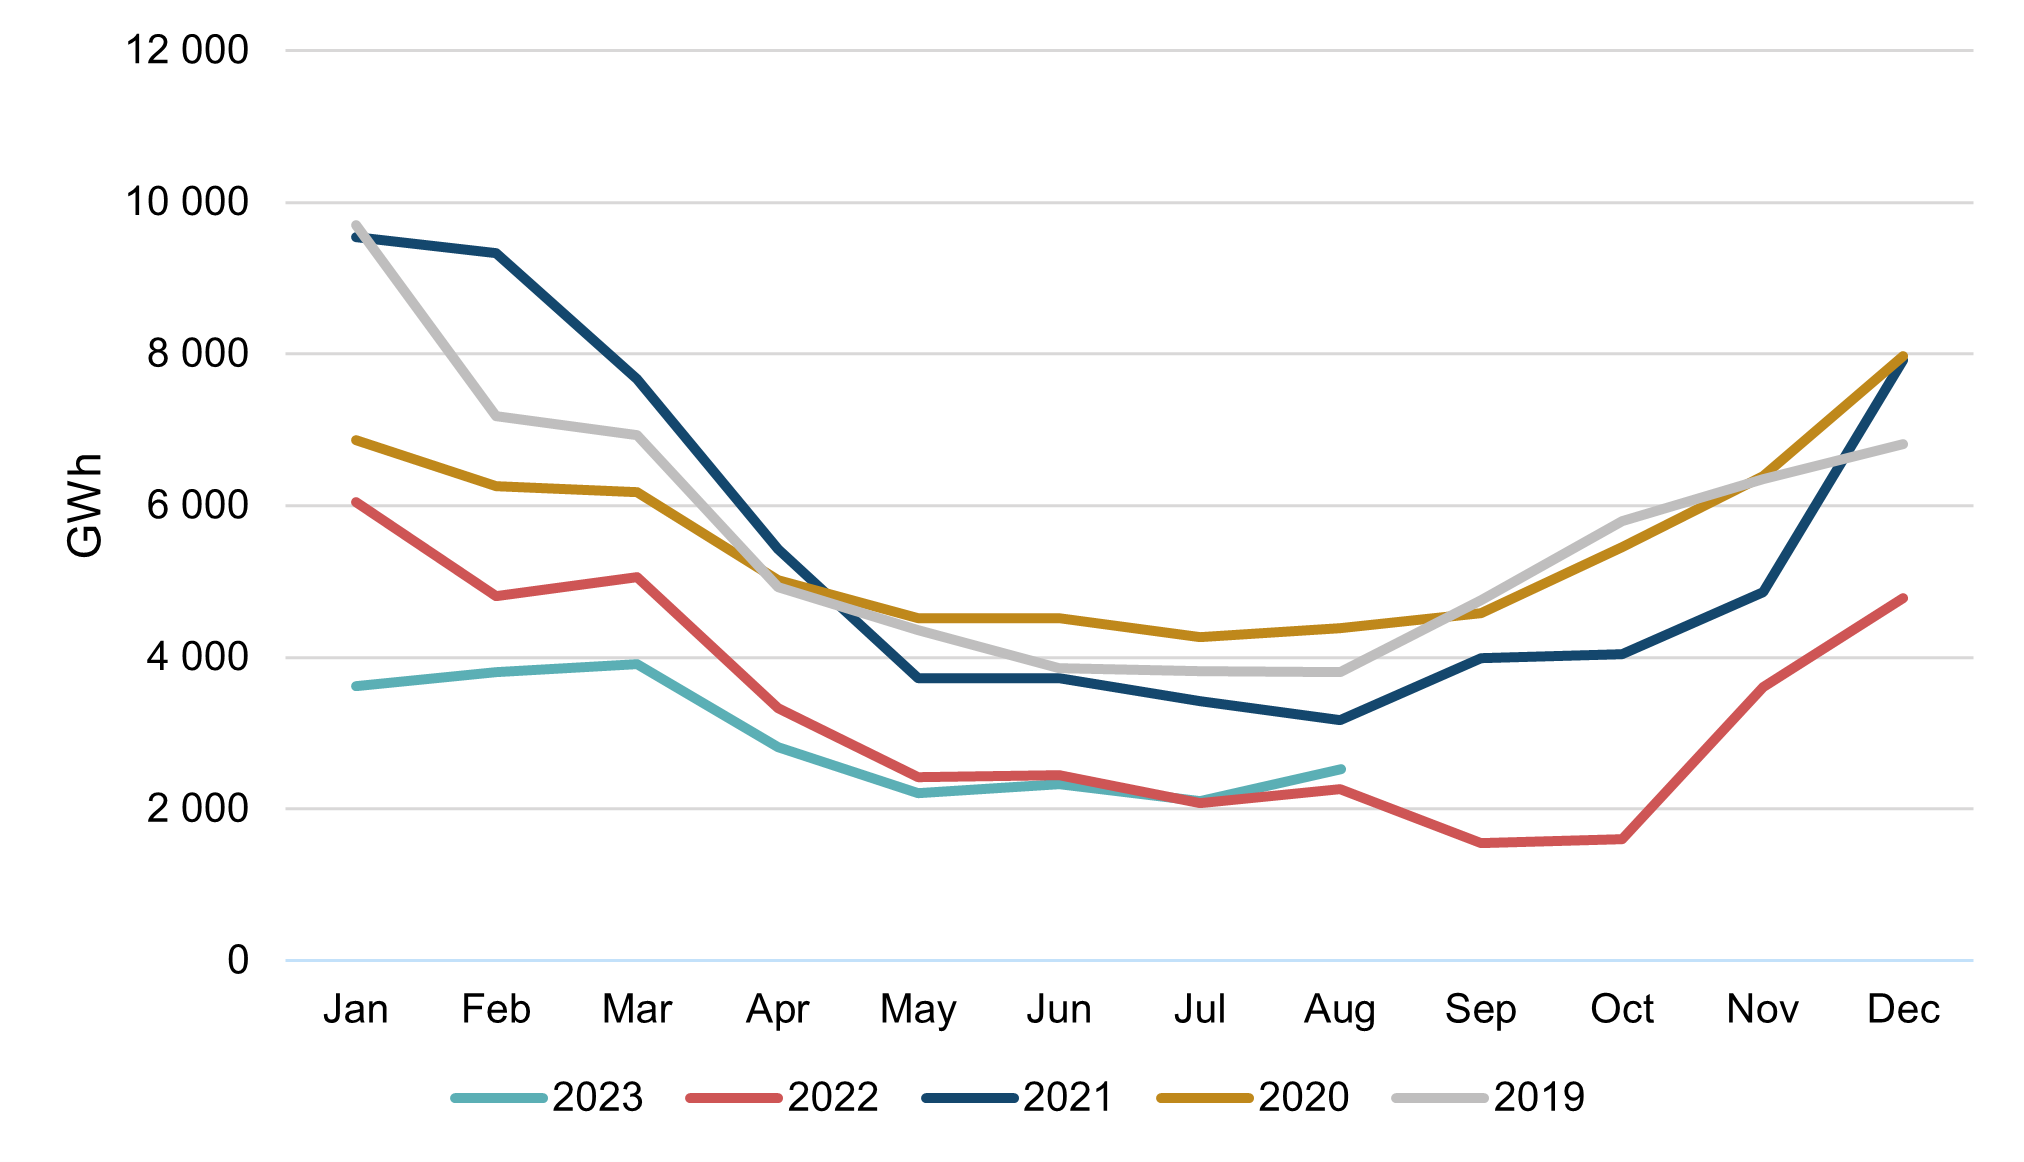
Figure 5. Baltic-Finnish combined gas consumption, 2019-2023, Argus
Gas consumption in the European Union has continued its decline, in July 2023, it saw a 7% year-on-year (YoY) decrease (Argus). However, in our home markets, July marked an important shift. It was the first month since the war in Ukraine when the combined Baltic and Finnish gas consumption exceeded that of the same month the previous year. The YoY rise in July was approximately 1%, increasing from 2.07 TWh to 2.1 TWh. In August this number surged to 12%, climbing from 2.27 TWh to 2.53 TWh. However, both figures remain notably lower compared to the years preceding 2022 (see fig.5).
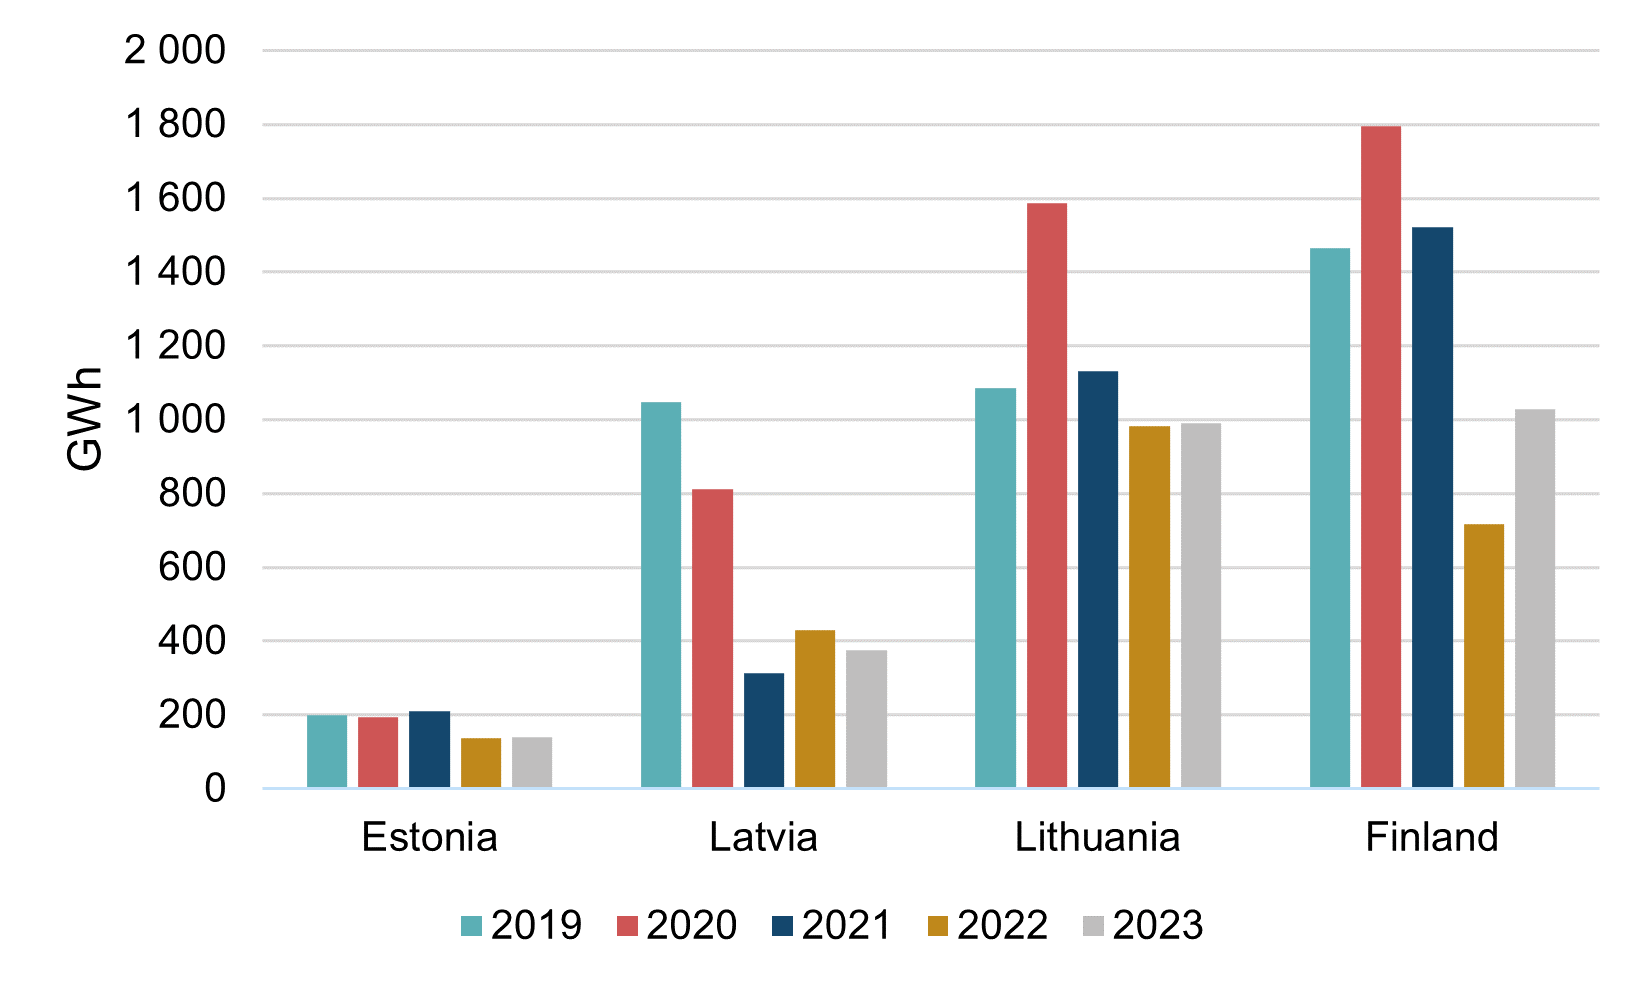
Figure 6. Baltic-Finnish gas consumption in August, 2019-2023, Argus
It is important to note that the variation in consumption numbers between the countries in our region is quite significant. Taking a closer look into August consumption numbers (see fig.6), it is evident that the YoY growth in region’s total consumption has been driven primarily by Finland, where consumption surged by over 43% in that time period. On the other hand, Estonia and Lithuania saw relatively stable consumption in August compared to 2022, while Latvia observed a further decrease in gas consumption.
The key driver behind the remarkable growth in Finnish gas consumption was power generation. As power prices in Finland jumped to highest levels of 2023, there was a significant incentive for gas-fired generation (Argus). Analyzing the potential for overall demand recovery, it’s evident that lower prices encourage consumers to shift back to using gas. However, for a substantial demand recovery, a continued easing of prices is necessary.
Australian strikes highlight the global nature of LNG market
In August, two important LNG producers in Australia, Chevron Corp. and Woodside Energy Group Ltd, faced the looming threat of strikes as worker unions expressed dissatisfaction with current working conditions. While Australia was the biggest LNG exporter in 2022, they have been dethroned from this position by USA and Qatar. Nevertheless, Australia still exports around 20% of the global LNG, more specifically 1187 TWh is their expected export figure in 2023 (see fig. 7). Facilities owned by Chevron and Woodside contribute to around half of the export volume. Despite of the fact that almost all of the LNG produced in Australia is being sent to Asian markets rather than Europe, European prices still saw a significant spike, as prices surged up to 35%.
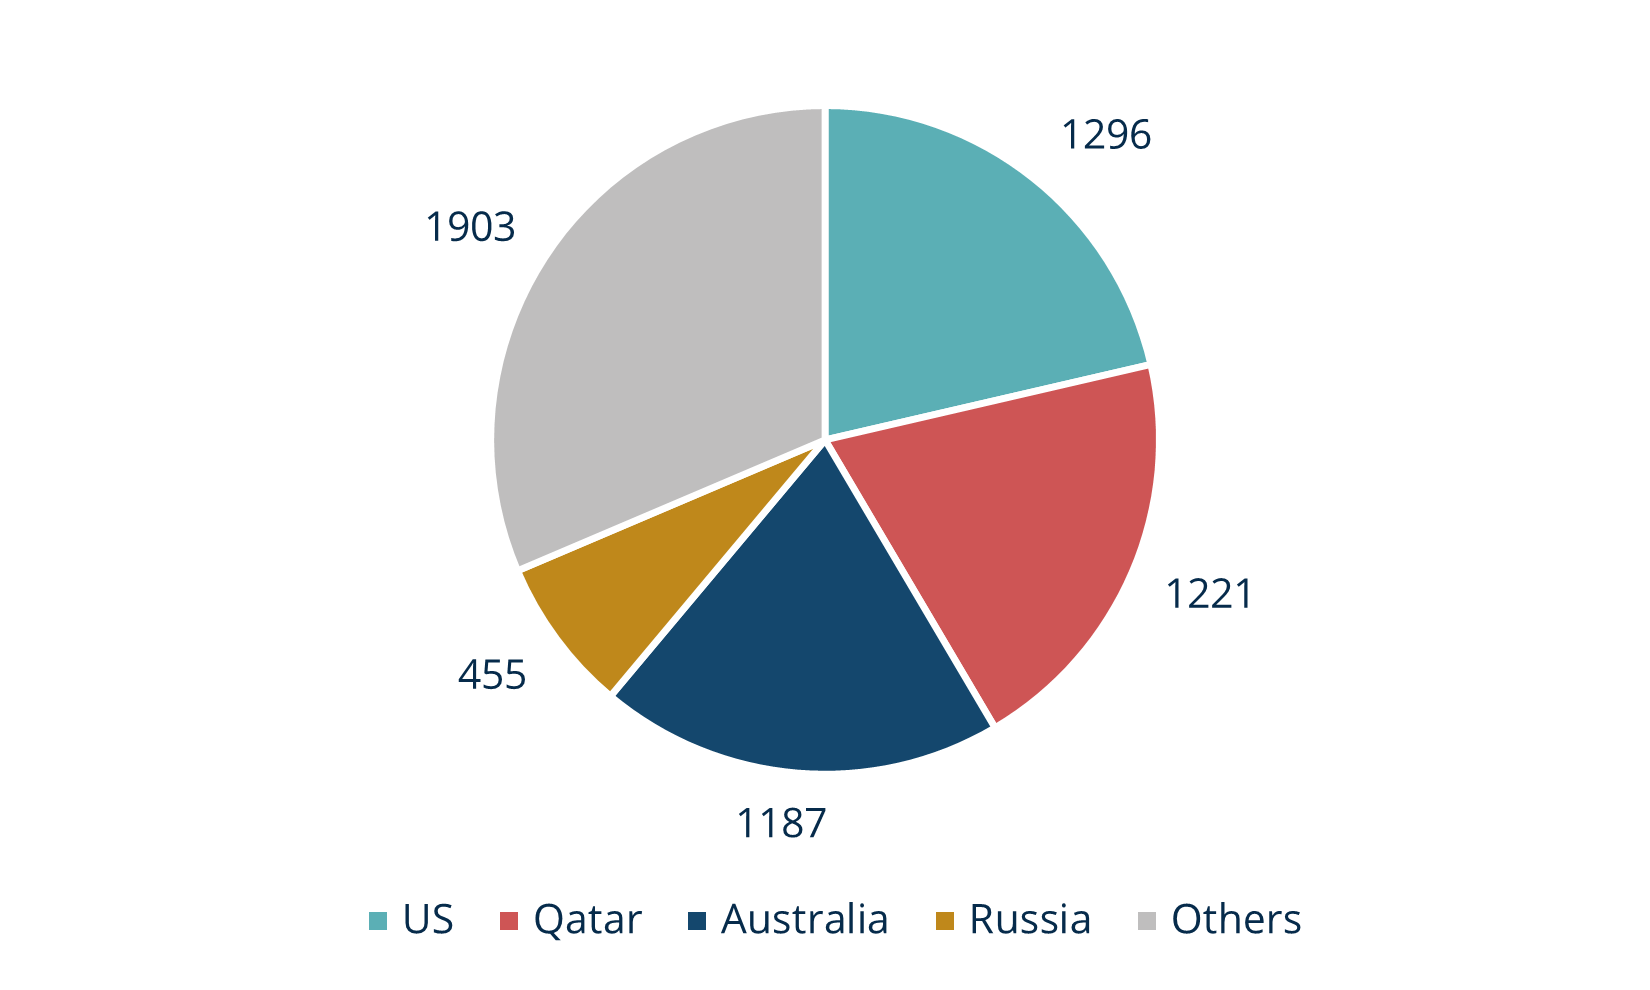
Figure 7. Forecasted 2023 LNG supply (TWh), Argus
This effect can be explained by the fact that Asia and Europe are competing for the same global LNG supply. In the event that Australia or other suppliers, primarily delivering to Asia, reduce their production, Asia would be compelled to secure the cargoes initially intended for Europe. This would inevitably exert upward pressure on prices across all markets, including Europe.
This highlights the global aspect of LNG market, where shifts in supply and demand have an effect to prices across regions. Therefore, nowadays European gas markets are much more influenced by the developments in other continents as well.
Fortunately, Woodside swiftly reached an agreement with the worker’s union, bringing relief to the market and restoring prices to levels observed prior to the strike concerns. Chevron and the workers union had to involve Australian Fair Work Commission, but the agreement was reached and situation was solved, Australian LNG export numbers were not affected after all.
What to expect from winter ahead
The seasonal rise in prices in winter is a normal trend, but current market indicators do not suggest a significant price spike. The forward curve indicates around 10% increase (see fig. 2). Nevertheless, prices in energy markets prices are heavily influenced by weather conditions, which, unfortunately, are quite unpredictable. Consequently, in daily prices we will definitely experience some volatility, inherent to the natural volatility of energy markets, as daily changes in temperatures will strongly impact demand. However, on a broader scale gas storages are approaching full capacity which is very important to the security of physical supply. Additionally, compared to the previous winter, new delivery routes have been established, and new terminals are now fully operational in place across Europe (in our region Inkoo terminal in Finland became fully operational in spring). These factors suggests that there is no physical deficit of gas, contributing to much lower prices compared to last winter.
This market overview is for informational purposes only. We aim to compile the most relevant data from various sources in good faith but the analysis should not be treated as an advice or taken as the sole basis for any action.